
No other division is as number-driven as sales. What does the forecast look like? How can I optimize my sales potential? Using your gut feeling is outdated. Daylite already offers you some tools to manage your sales. As strategic planning instruments, iOSXpert now offers you 2 new reports: Sales Forecast and Sales Analysis.
Sales Analysis
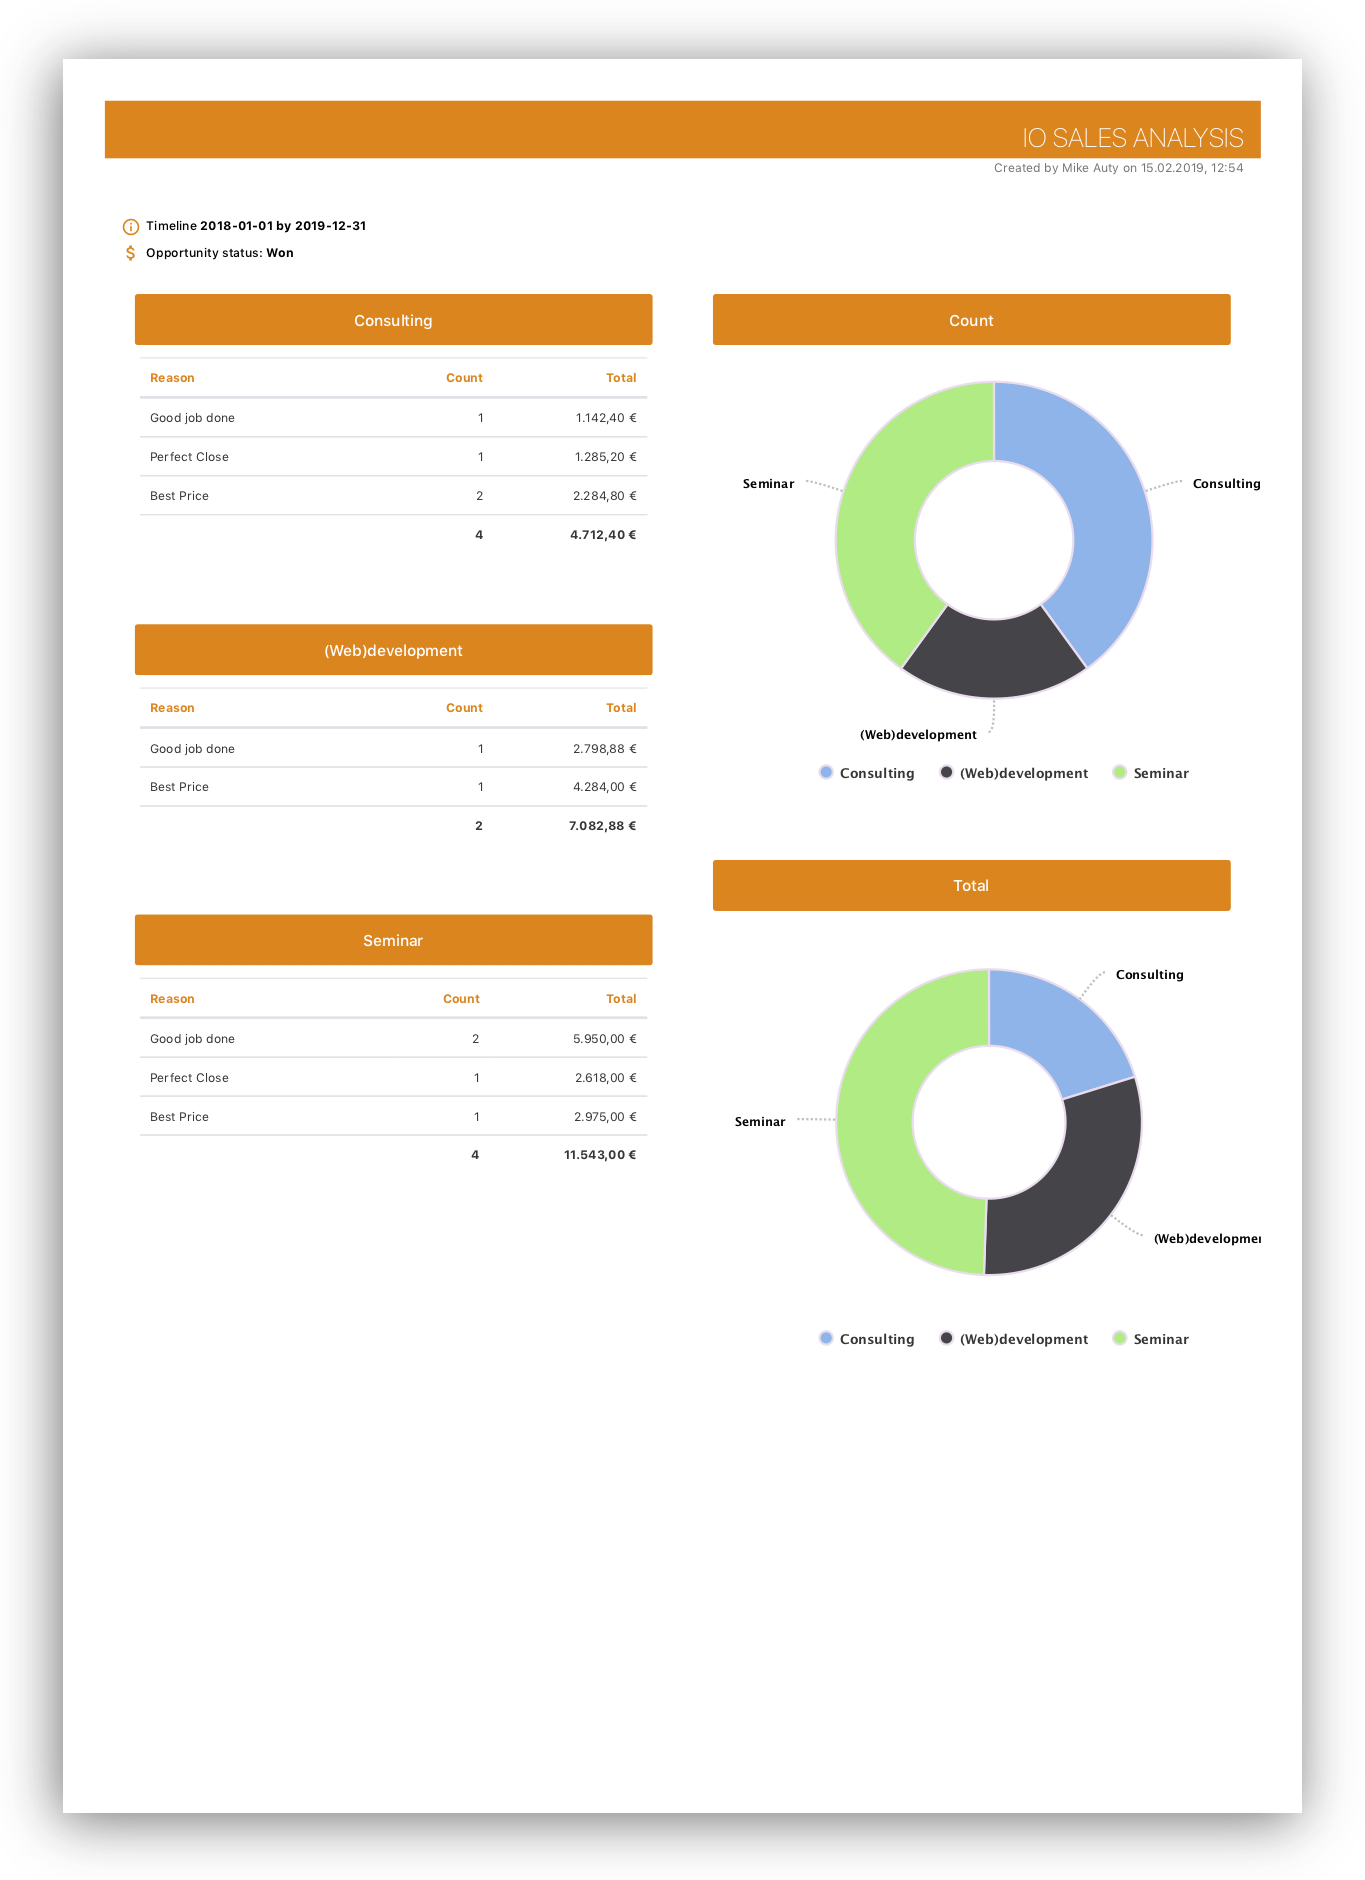
Optimize your sales potential through a differentiated analysis of your sales opportunities: Which sales opportunities have been closed, which have you lost.
Define a time period to analyze which sales volume and how many opportunities have been won, lost, postponed, or discarded for which reasons. You can customize these reasons in the Daylite settings.
A grouping by categories reveals further optimization potential and presents the reasons in a clear table. The number and volume of opportunities are also displayed as pie charts in order to always keep an eye on the distribution.
The color scheme is clear and can be adapted to your corporate design using the Report Designer.
Sales Forecast
View your sales opportunities from a new perspective. In just one report you get an overview of your past and future sales opportunities, can quickly make decisions, or improve existing processes.
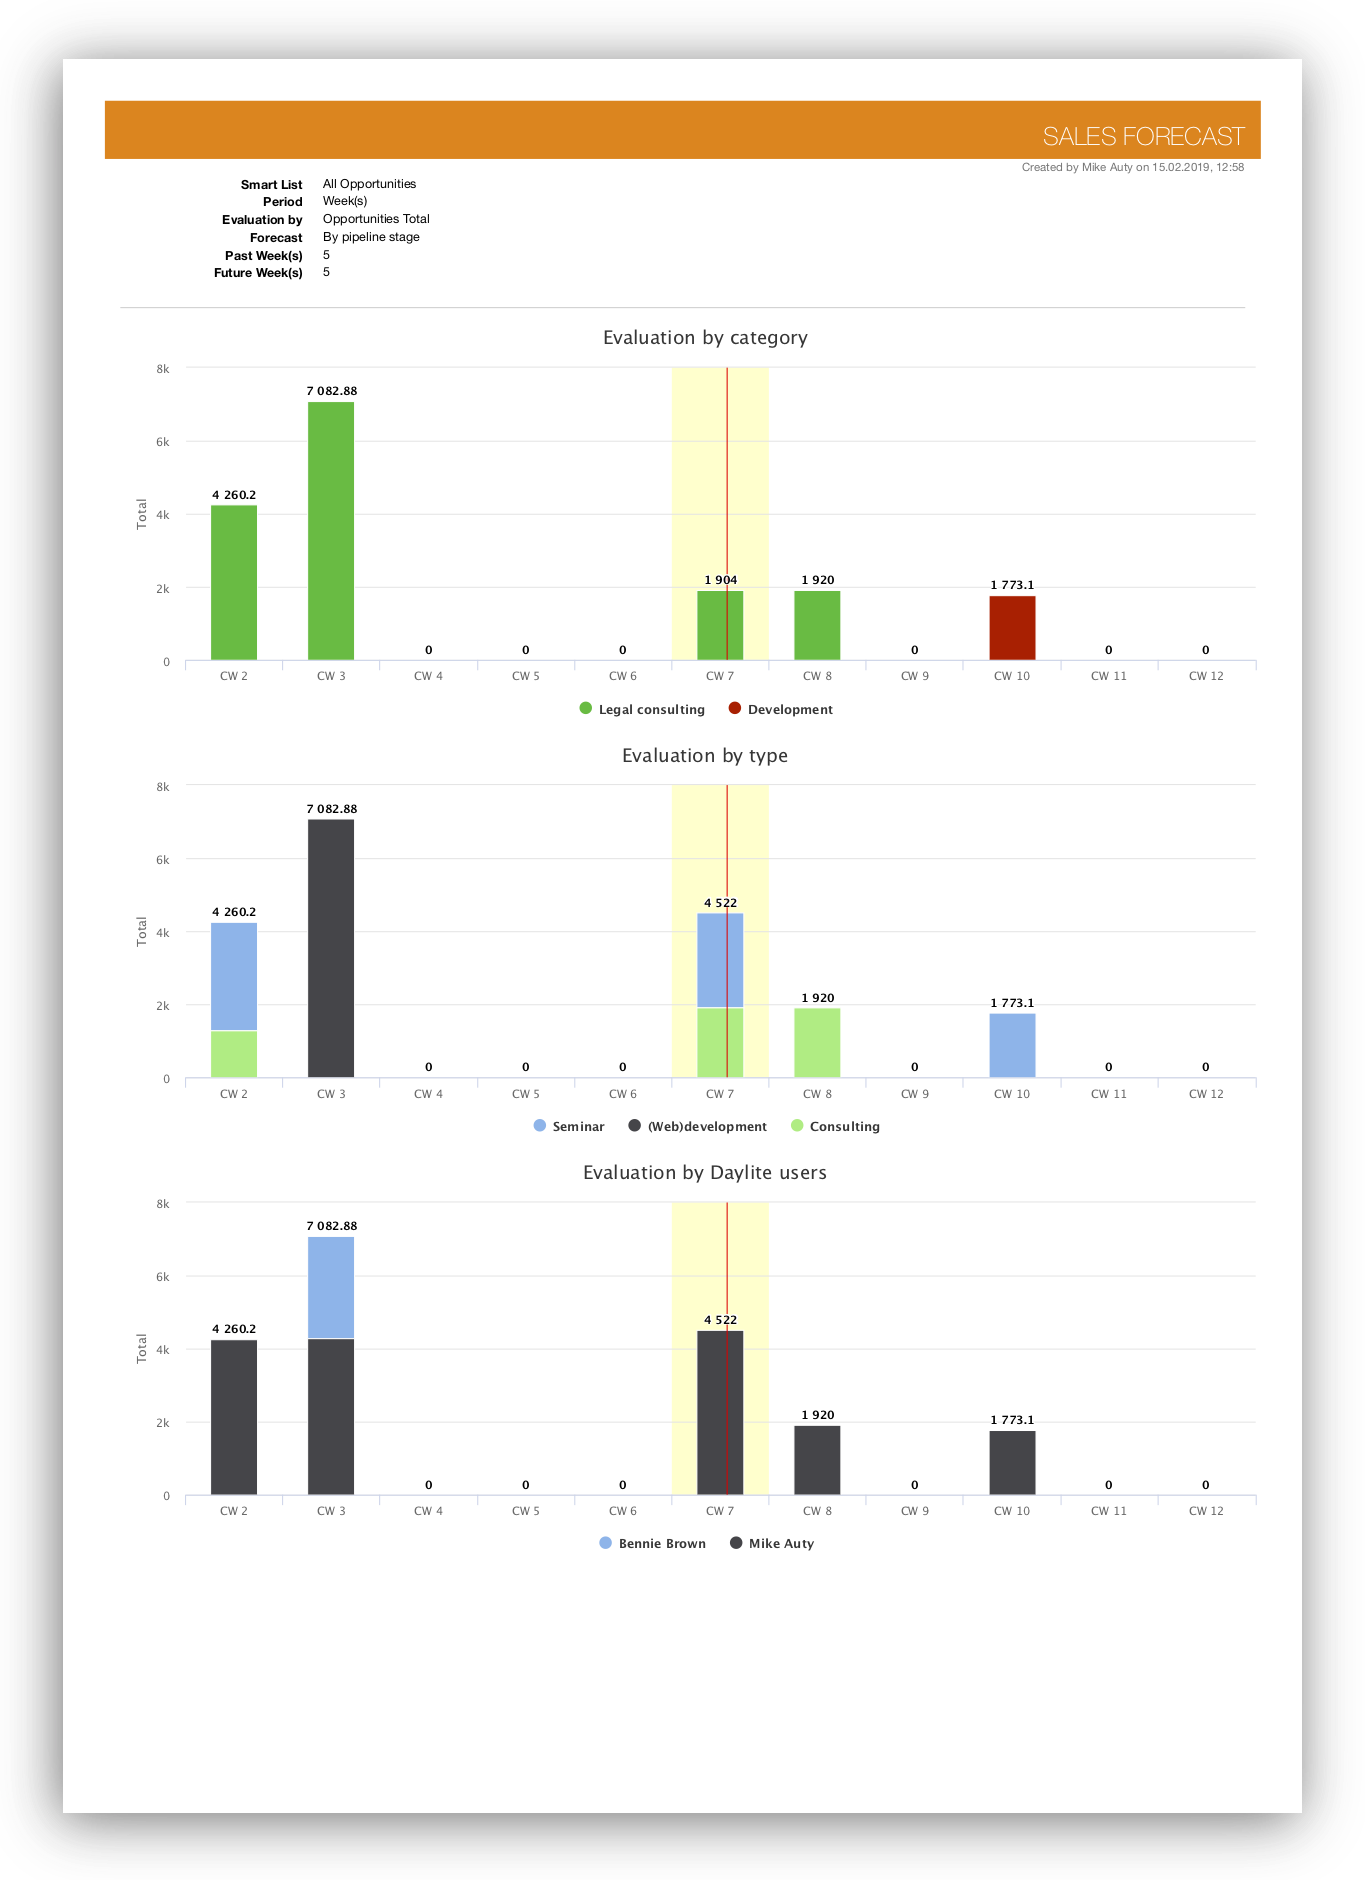
The report is highly customizable to your needs:
- Select all sales opportunities or one of your smart lists with a selection of sales opportunities.
- The value of the opportunity can be defined by volume, cost of goods, or profit.
- For sales opportunities that are still open, the value can be displayed based on the probability entered or in relation to the pipeline level reached (at 2 of 4 levels = 50%).
- The time periods can be displayed as weeks, months, quarters, and years.
- You can set how many time periods you want to view in the future and/or the past.
The now selected parameters determine which opportunities are displayed.
In the display, you can define whether you want to group the opportunities by:
- Opportunity category
- Opportunity type
- Owner/Sales Representative
- Products & Services
A further Y-axis represents not only the volume of the sales opportunity but also the number of opportunities.
This gives you a “toolbox” for almost any controlling question in a single report.
Want to learn more about our reports?
• How can I buy iOSXpert reports and lists?
• How can I use an iOSXpert report?
• How can I customize an iOSXpert report?
We are here to help!
Any questions? Contact our team or visit our HelpCenter.

